The answers and suggested code below are for the extended practical session that allows you to implement basic DataSHIELD functions and interpret the results.
| Code Block | ||
|---|---|---|
| ||
# load libraries
library(opal)
library(dsBaseClient)
server <- c("study1", "study2", "study3")
url <- c("http://XXXXXX:8080")
table <- c("DASIM.DASIM1", "DASIM.DASIM2", "DASIM.DASIM3")
logindata <- data.frame(server, url, user="administrator", password="datashield_test&", table)
# login and assign the whole dataset
opals <- datashield.login(logins=logindata, assign=TRUE) |
Subsets and Statistics
- Calculate the mean and the variance of the continuous variable BMI of obese males.
...
| Tip | ||
|---|---|---|
| ||
The global mean and the global variance of BMI are 33.04723 and 6.134642 respectively. |
Assign and Plots
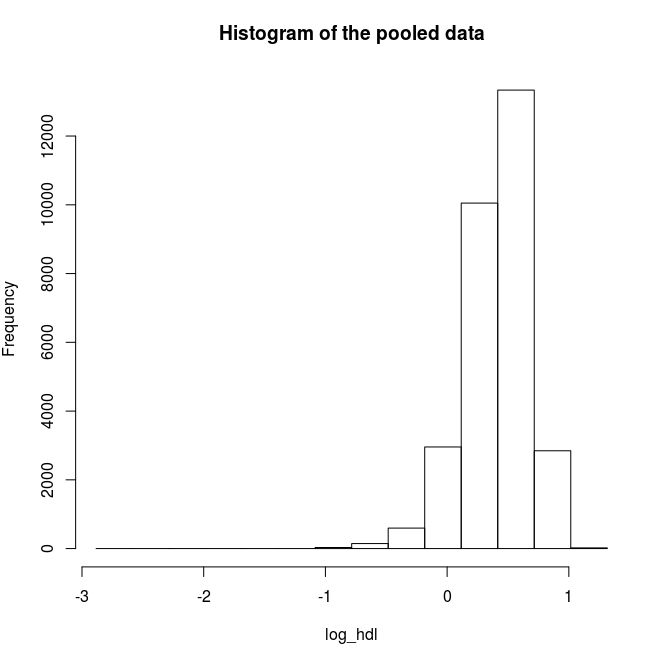
Find the quantile mean and plot a histogram of pooled data for the exponent and for the logarithm of LAB_HDL measurement.
...
| Tip | ||
|---|---|---|
| ||
Quantiles of the pooled data 5% 10% 25% 50% 75% 90% -0.06384112 0.06994799 0.26052368 0.44043450 0.58983773 0.71059831 95% Mean 0.77301979 0.40754040 |
2-dimensional contingency tables
- What percentage of females (pooled data) are diabetics?
- What percentage of males in each study separately have stroke (DIS_CVA)?
...
| Div | ||
|---|---|---|
| ||
Generalized Linear Models
- Apply a generalised linear model that predicts the level of glucose between males and females. What is the predicted average level of glucose for males? What is this value for females?
- Apply a GLM to predict the level of glucose using gender and continuous bmi. How much the level of glucose is increasing with the increase of bmi by one unit? What is the predicted glucose level of a female with bmi=22?
...