Become familiar with R Studio and basic concepts of R
Installation of R Studio
R Studio is a multi-platform integrated development environment (IDE) specialised for R programming. R studio can be downloaded and installed from this website: https://www.rstudio.com/. The software is open-sourced and can be downloaded free. An installer suitable for an operating system needs to be downloaded, otherwise no installation occurs.
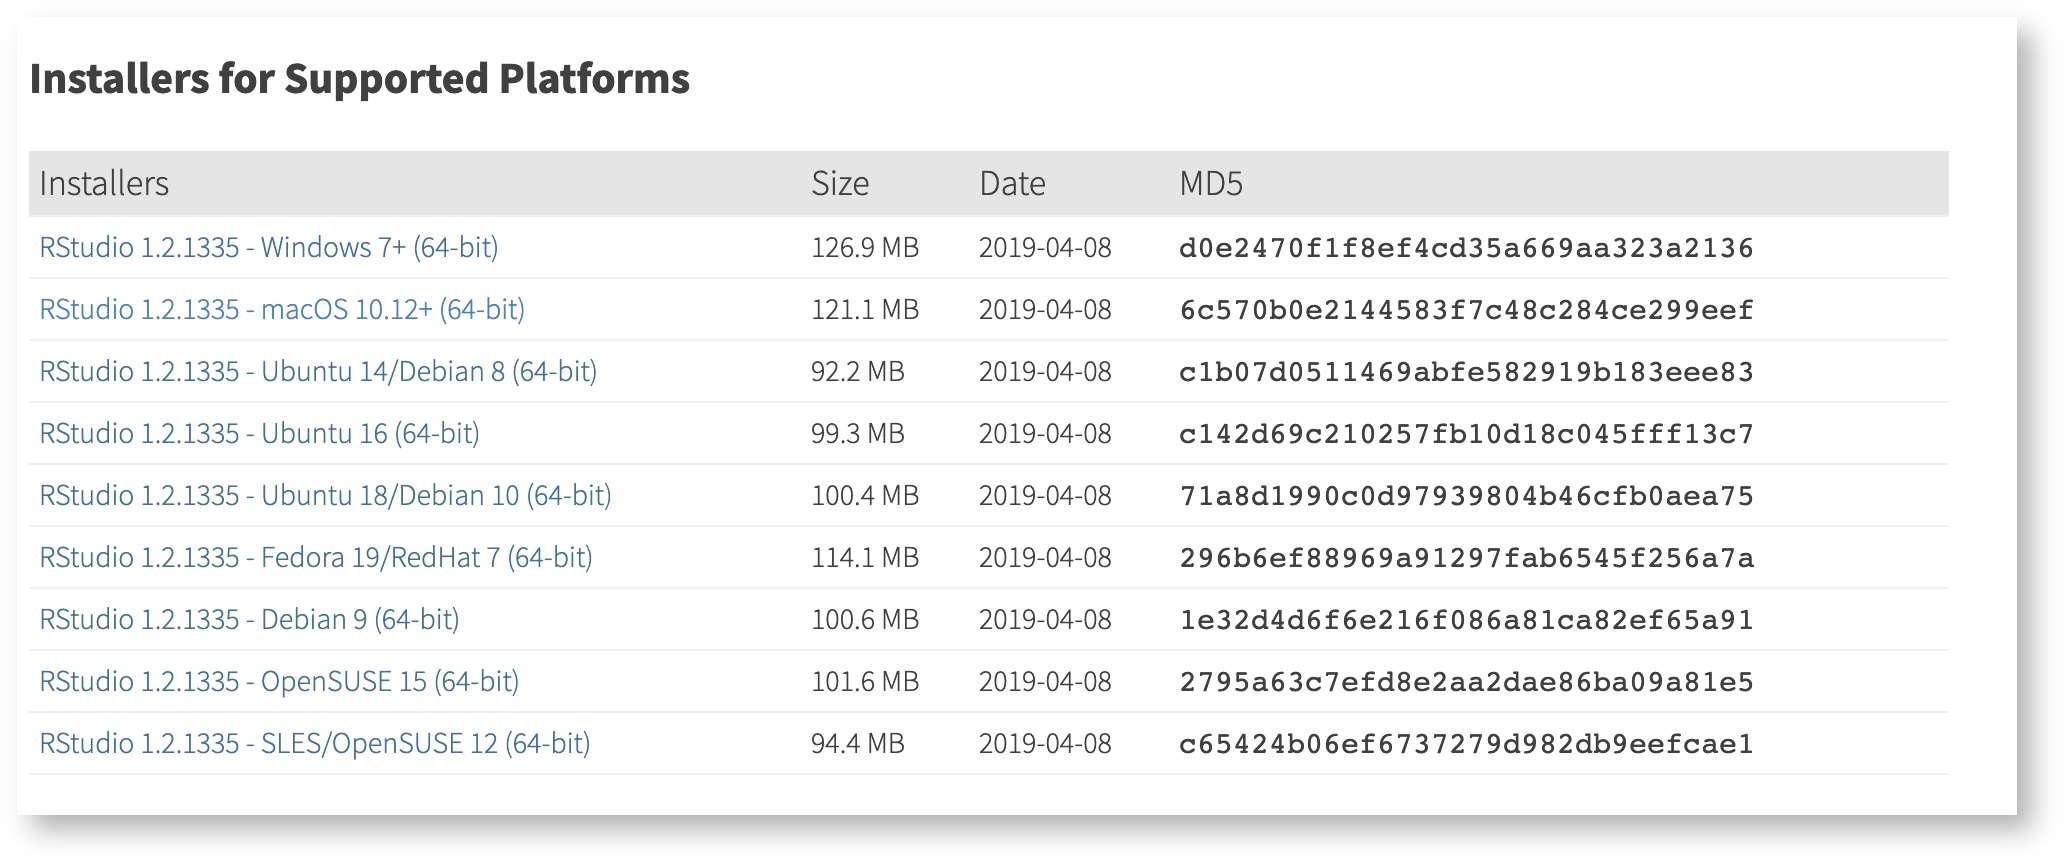
source: https://www.rstudio.com/products/rstudio/download/#download
Please note:
The R framework needs to be installed separately from R Studio (see What is R programming language?)
The R Studio Interface
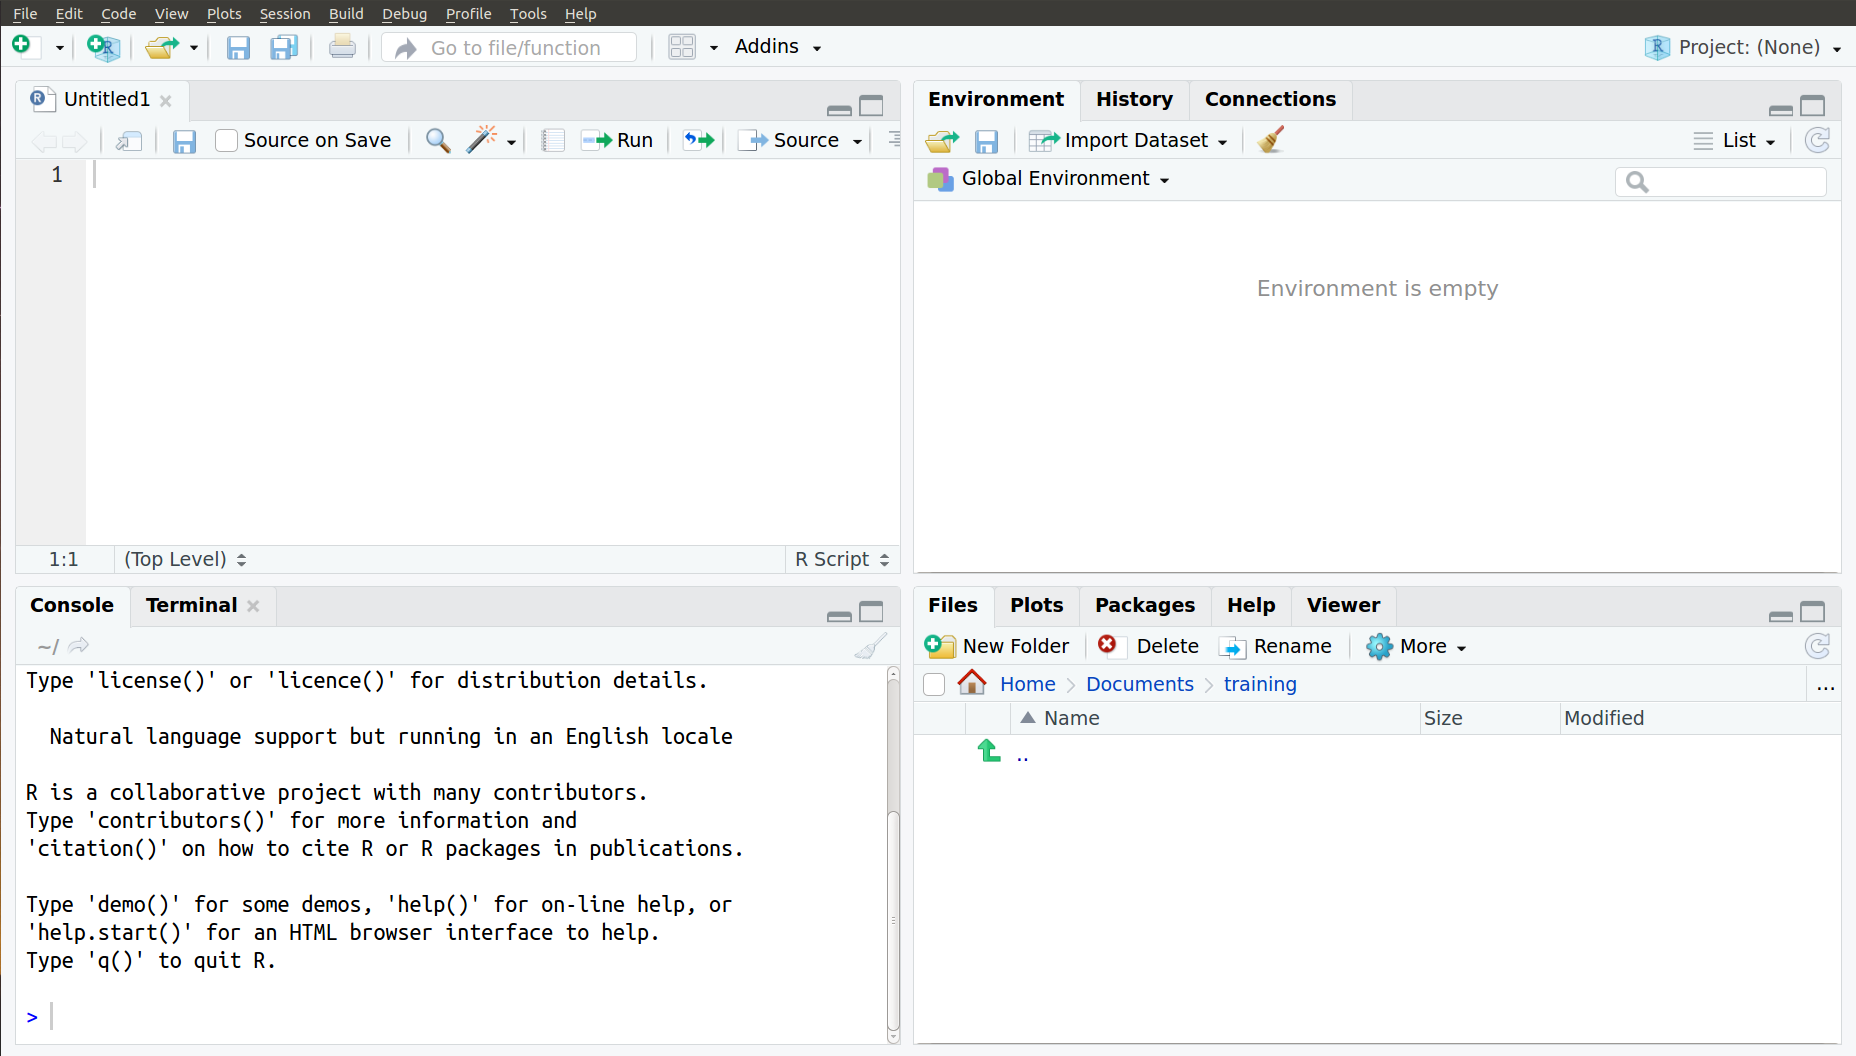
The R studio has four quadrants:
| Section | Purpose |
|---|---|
| Top left | R scripts open, and are available to be edited and saved. |
| Top right | The Environment lists all the variables and functions defined and used in a session. History lists all the command typed in the console. Connection can help you to connect to a database, it is an advanced feature.. |
| Bottom left | The R console allows running some commands directly after the cursor |
| Bottom right | The File explorer is a file-management tool. The plotting screen shows graphs being plotted. The packages lists allows to loads and attach adds-on packages. The help provide some useful information about some functions provided by some packages and the R languages. |
Some output example from the console:
print("hello world!")

[1] "hello world!"
Practice - using the console, history and environment tools
The console lets typing some R commands. The results can be viewed quickly in the history and environment. The work is likely not to be saved once R Studio is closed or a session is finished. You will need to type some code next to do > cursor.
Hello world! and the History tab
type print("hello world!")
Print functionprint("hello world!")- Go to the History tab. Double click on the last command typed.
- Can you print another message?
Variables and the environment
Beginners and not-quite advanced readers
Before continuing with this part of the practice, you should read the sections on data types and variables (see reading list). It should clarify the concepts of data types as well as variables in R. Some interactive and live demo can be edited to deepen your learning.
Logical variables also known as Boolean variables
- Create a logical variable called is.raining: Type is.raining <- TRUE
- Look at the Environment tab, the variable referred as is.raining should appear.
- Set the value of the variable is.raining to false. Type is.raining <-FALSE
- Look at the Environment tab, the value of variable referred as is.raining should be changed.
Integer and decimal variables
- Create a numerical variable called water.freezing.point and set it to 0 or 32.
- Create another variable called humidity and set it to 0.70.
- Look again in the Environment tab. Three variables should be shown with their data type
Character variables
- Create a character variable called my.location. Set it to Newcastle (or anywhere you wish to be!). Type my.location <- "my.location"
- Look again in the Environment tab. Four variables should be shown with their data type
Vector and lists variables
- Create a vector variable called temperatures and set its values to 34, 32, 56, 67,90. Type temperatures <- c(34,32,56,67,90)
- Create a list variable named weather. Set its content with all the variables created so far. Type weather <- list(humidity,is.raining, water.freezing.point, temperatures)
- Look in the Environment tab the changes. Have double clicked on the magnifying glass?
Additional reading list |
|---|
Let's complete some calculations
Beginners and not-quite advanced readers
Before continuing with this part of the practice, you should read the sections on operators (see reading list). It should clarify the concepts of data types as well as variables in R. Some interactive and live demo can be edited to deepen your learning.
Arithmetical operators
- Multiply the humidity by 0.01 and name the outcome results; a new variable should be created. Type result <- humidity * 0.01
- Multiply the humidity by 0.01 and name the outcome humidity; the value of humidity should change. Type humidity <- humidity * 0.01
- Look in the Environment tab the changes. Have double clicked on the magnifying glass?
- Try to complete as many calculations you wish to practice your arithmetical operators. Look in the environment tab the changes ....
Something not to do....
R is not strongly typed. For that reasons, a variable created as a logical can become a character. It can break many calculations and it is not advisable to use. However, it is worth exploring what is happening.
- Type is.rainint <- "Oh no, what have I done!"
- Repeat step one for each variable created in your environment tab.
- Look what is happening in the Environment tab
Using scripts
Scripts can permanently save some R commands and R programs. The latter are often structured, so that they can be understood without any confusion. A script is a record of the analyses that are completed and typically will run again. Scripts often tell a story with a clear start and clear end. At the start, we obtain some data before analysing them with some R functions. Then we show the results in a clear manner with a variety of graphical representation.
To make your script clear and easy to use again, it helps to do the following:
- Annotations in the script, called comments, aid users in understanding the script and are denoted by
#at the beginning of each line. - Comments do not run in the console. They are ignored by the R interpreter.
- It is good practice to put a description at the top of your script: what it is for, author, date, dataset used, purpose of the script. This is will serve as a reminder as to what the script is for in the future.
Practice - How to create a script?
Open up a new script by selecting from the top left icon for New File
![]()
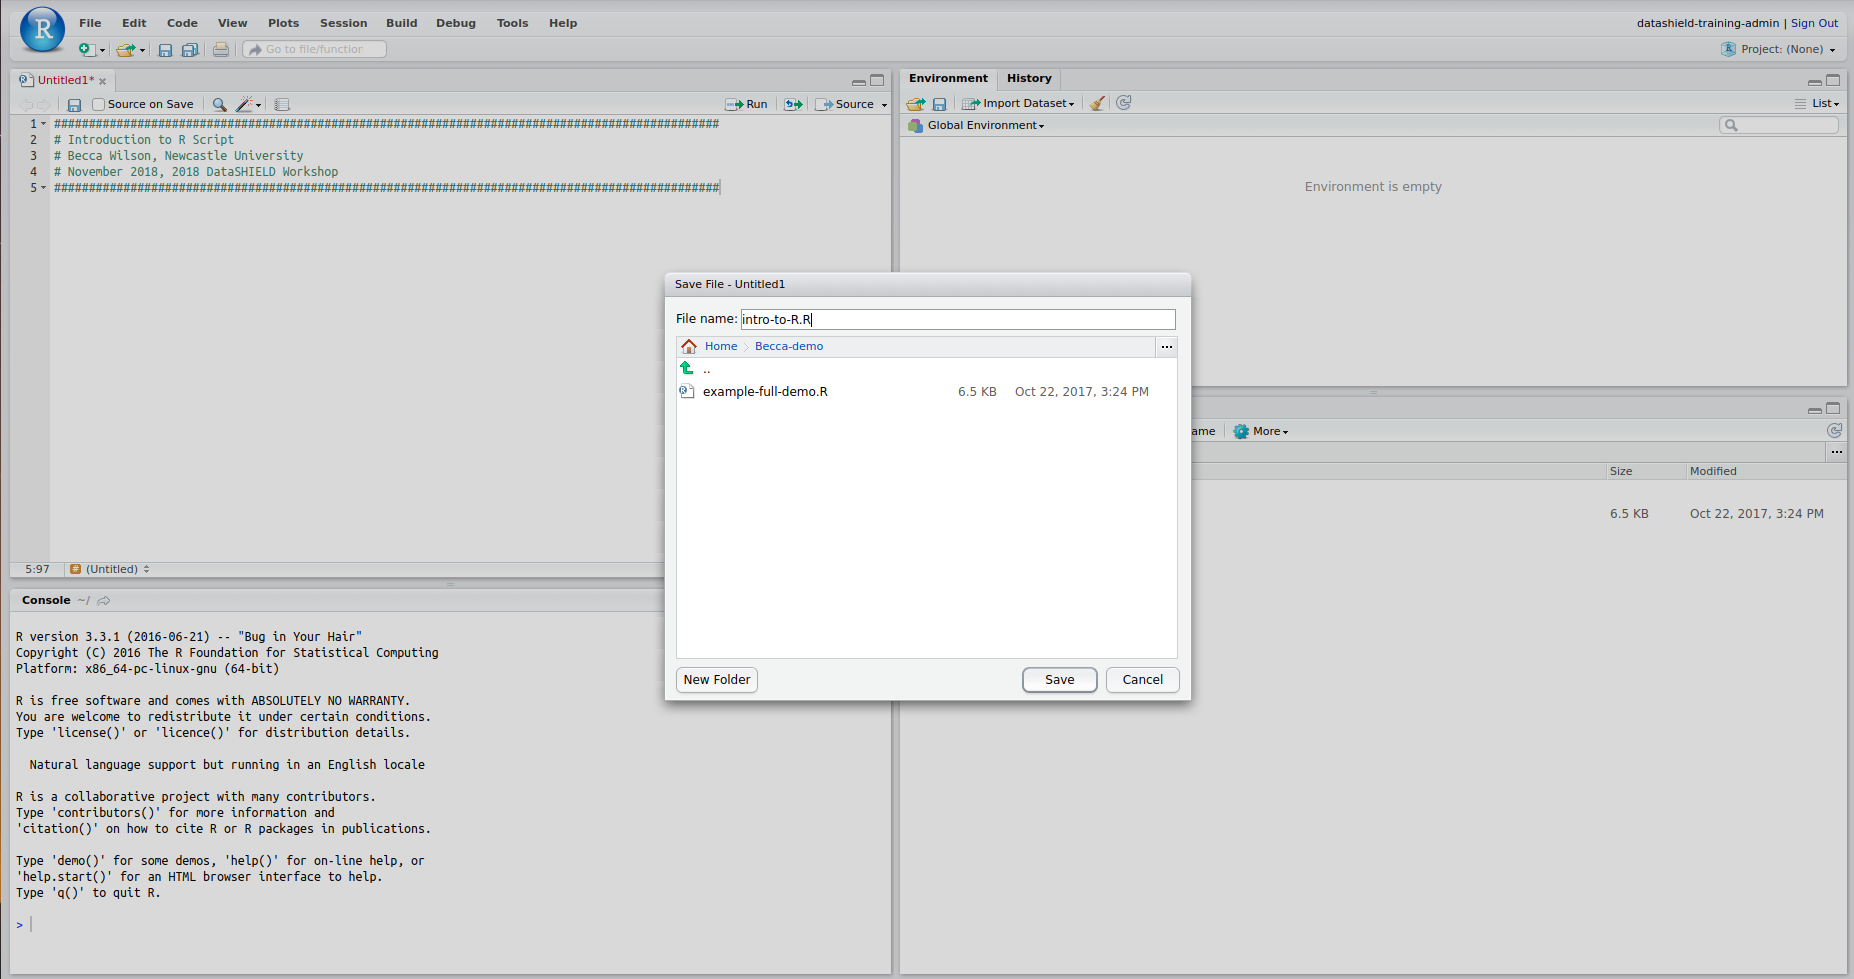
- Complete a description of your script and then save it as a
.Rfile in your folder by clicking the save icon ( a blue disk).
Practice - writing scripts, using the help and plots
For this exercise, some temperatures for a whole year will be randomly generated and stored in a vector. Some statistical analysis is completed before showing the results of the analysis. We will be using some statistical function already implemented in R. Finally, commenting will be encouraged to communicate the structure and ideas used in the script.
Beginners: Write a simple script with some comments, using the some examples from the tutorial. It would be a good thing to use some graphical representation using the functions plot or hist.
Not quite advanced users: Write a more complex script and try to complete some calculations using the results of the statistical functions. Have you considered to using a range of parametric and non-parametric statistical methods.
Advanced users: Write a script with several levels of analysis. Considering and verifying the data is clean (i.e., no non-numerical in the vector) would be a good thing to do.
Generating the data
- Using the help feature (bottom-right of the screen), search for the function sample. Then, read the documentation, especially the example section.
- Type the example in the console. Run the example to check it is working.
- Create a new script and save it with a suitable name; i.e., weather_analysis.R
- Simulate some data for a fictional place called New Blyth for a whole year. Type in the script, the following line of code: temperatures <- sample(-5:30,365,replace=TRUE).
- Save your script. Highlight the whole line and click run. The code should be executing in the console.
- Click on Source. The code should be executing in the console.
Analysing the data and printing the results
- Using the help, identify some functions too compute some statistics. You could use some measure of centrality and dispersions.
- Write in your script your analysis.
- Use some print statements to show your findings.
- Execute your script
An incomplete script could look in this manner.
Example of script
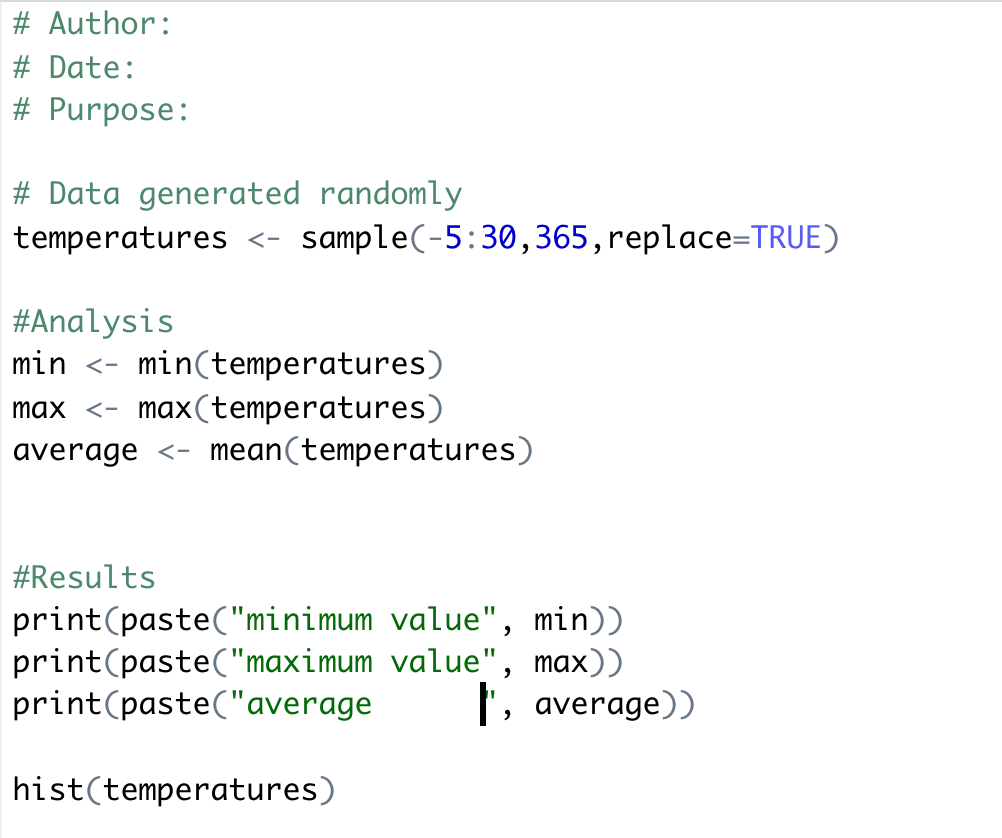
The outcome should be similar as this....
 print(paste("minimum value", min))
[1] "minimum value -5"
 print(paste("maximum value", max))
[1] "maximum value 30"
 print(paste("average      ", average))
[1] "average value 12.3150684931507"
Finally, commenting your code
Read again your script and comment each section, with some explanations.
Practice - writing scripts and your own functions ("not quite advanced" users and advanced users)
Before continuing with this part of the practice, you should read the sections related to decision making and function(see reading list). It should clarify the concepts of data types as well as variables in R. Some interactive and live demo can be edited to deepen your learning. It is advisable to practice in the live demo the following R statements: if, if ...else ..., switch. You should also use the help to find more about the stop function.
Additional reading list |
|---|
We cannot divide by 0!
- Create a new script and save it as division.R
- Type the following code and save it.
- Click on Source to run the code
Code to be typed:
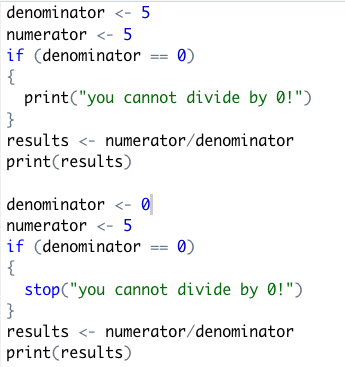
The results should show the following results. The source function was invoked and all the code was interpreted, lines by lines. The first division was possible and the code within the if statement was not executed. The second division was not completed. the condition of the if statement was met. The stop function interrupted the execution of the script altogether.
[1] 1
Error in eval(ei, envir) : you cannot divide by 0!
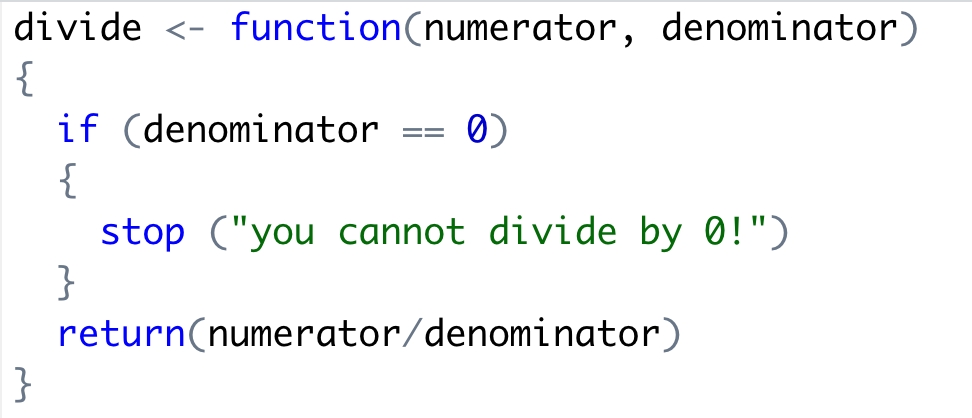
How can we prevent the repeated code?
The above script has a lot of repeated code, which is an undesirable feature to any script. It is more challenging to maintain. For that reason, it is better to promote code re-use.
- Write again your script as a function.
- Save your script and click on Source.
How can I test my function?
In the console, test your function with a range of values for the numerator and the denominator.
- Type result ← divide(5,0)
- Type result ← divide(78,4)
- Type your own example
The output should look in this manner ...
result1 <- divide(5,0)
Error in divide(5, 0) : you cannot divide by 0!

result2 <- divide(78,4)
print(result2)
[1] 19.5
What Can I learn next?
Vectors, Lists, Data frames and Tibbles

DataSHIELD Wiki by DataSHIELD is licensed under a Creative Commons Attribution-ShareAlike 4.0 International License. Based on a work at http://www.datashield.ac.uk/wiki