...
| Tip | ||
|---|---|---|
| ||
DataSHIELD support is freely available in the DataSHIELD forum by the DataSHIELD community. Please use this as the first port of call for any problems you may be having, it is monitored closely for new threads. DataSHIELD bespoke user support and also user training classes are offered on a fee-paying basis. Please enquire at datashield@newcastle.ac.uk for current prices. |
Introduction
This is the fourth in a 6-part DataSHIELD tutorial series. Please see below for links to all prior and subsequent parts:
...
Start R/RStudio
Load Packages
| Code Block | ||||
|---|---|---|---|---|
| ||||
#load libraries library(DSI) library(DSOpal) library(dsBaseClient) |
Build your login dataframe
| Code Block | ||||
|---|---|---|---|---|
| ||||
builder <- DSI::newDSLoginBuilder()
builder$append(server = "study1",  url = "http://192.168.56.100:8080/",
               user = "administrator", password = "datashield_test&",
               table = "CNSIM.CNSIM1", driver = "OpalDriver")
builder$append(server = "study2", url = "http://192.168.56.101:8080/",
               user = "administrator", password = "datashield_test&",
               table = "CNSIM.CNSIM2", driver = "OpalDriver")

logindata <- builder$build()

connections <- DSI::datashield.login(logins = logindata, assign = TRUE, symbol = "D") |
...
| Code Block | ||
|---|---|---|
| ||
DSI::datashield.logout(connections) |
Generating graphs
It is currently possible to produce 4 types of graphs in DataSHIELD: histograms, contour plots, heatmap plots and scatter plots.
Histograms
| Tip | ||
|---|---|---|
| ||
In the default method of generating a DataSHIELD histogram outliers are not shown as these are potentially disclosive. The text summary of the function printed to the client screen informs the user of the presence of classes (bins) with a count smaller than the minimal cell count set by data providers. Note that a small random number is added to the minimum and maximum values of the range of the input variable. Therefore each user should expect slightly different printed results from those shown below: |
...
| Anchor | ||||
|---|---|---|---|---|
|
Contour plots
Contour plots are used to visualize a correlation pattern.
...
| Anchor | ||||
|---|---|---|---|---|
|
Heat map plots
An alternative way to visualise correlation between variables is via a heat map plot.
...
| Tip |
|---|
The functions |
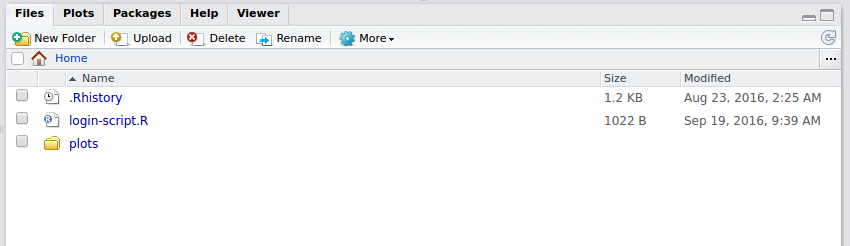
Saving Graphs / Plots in R Studio
- Any plots will appear in the bottom right window in R Studio, within the
plottab - Select
export>save as image
...
- The plot will now be accessible from your Home folder directory structure.
Conclusion
The next part in this DataSHIELD tutorial series is:
...