| Table of Contents |
|---|
...
| Spreadsheet | Statistical programming languages |
|---|---|
| Spreadsheets store data in a tabular format. Data stored in the database and standard file format can be imported to a spreadsheet. The maximum limit in Excel is 1,048,576 rows by 16,384 columns in Excel. | Statistical programming languages can also import data from a standard file format and databases. The maximum limits too a data frame R is 2,147,483,647 rows and 2,147,483,647 columns. Additionally, other formats, such as vector and single variables, can be used. |
| The calculations and the data are both stored in the same file. | Calculations and other computations can be separated. Some analysis can be executed with some different data, without writing again all the formulae. |
| Spreadsheet provides some graphical representation tools. Sometimes, some more advanced statistical representation are not available. | Statistical programming languages often provides a wider range of graphical representation tools of data. The latter can often be formatted and refined. |
| Sharing and mining data through spreadsheet can be a difficult task. The format of each spreadsheet is not guaranteed to be structured identically. The number of rows and columns can vary too. | Statistical programming languages provides some advanced tools to clean, mine, merge and analyse from several sources and format. Some scripts written with some statistical programming languages can share separately from the data; code re-use is promoted. Data can be exported and share using some valid and standard file format. |
| Spreadsheets are often provided as a part of an office package; i.e., Office libre, OpenOffice and Microsoft Office. Some of the spreadsheets are free; some require to purchase for a license. | Statistical programming languages rely on some Integrated Development Environment (IDE) to write their code. A lexicon provides a list of keywords to be used by the programmers so that an interpreter can interpret the code. The latter is often integrated with some IDEs but can be run directly by a command-line interface. Some statistical programming languages and IDEs are free. Some others require a license to be purchased. |
...
Additional reading list |
|---|
Installation of R
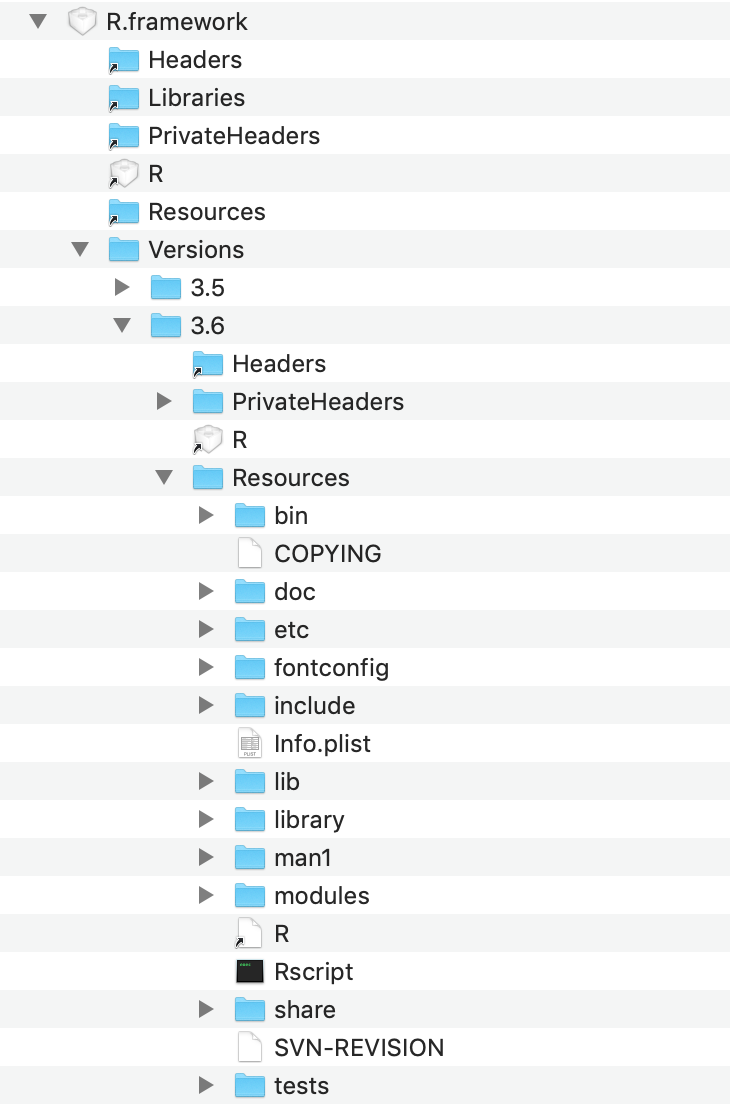
R can be installed using the preferred method of installing software for an operating system; some links are provided as an additional reading list. Some installation software should be first downloaded. Then, the installer should be run to create the R framework. On the left hand-side, the folders (or directories) of an R framework are shown. This complex structure, inspired from Unix traditional folder structure, is required to execute and interpret any R code. The R framework is written in R, C, C++, Java and Fortran. For that reason, R is easily extensible.
Some warnings:
|
...